In a seminar I introduced the violin plot and showed the following figure(this example comes from the help document):
library(vioplot)
library(sm)
par(mfrow = c(1, 2))
mu <- 2
si <- 0.6
bimodal <- c(rnorm(1000, -mu, si), rnorm(1000, mu, si))
uniform <- runif(1000, -4, 4)
normal <- rnorm(2000, 0, 3)
vioplot(bimodal, uniform, normal)
boxplot(bimodal, uniform, normal)
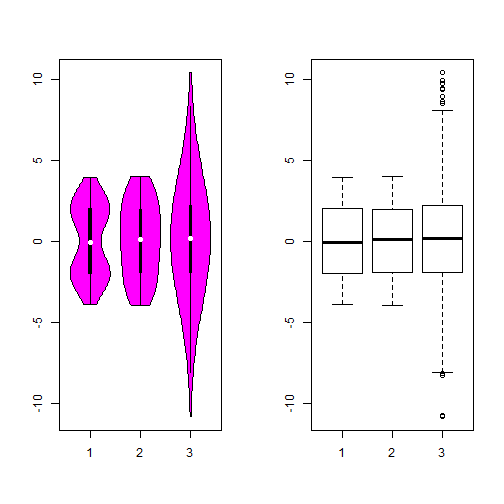
So obviously, the violin plot can show more information than box plot. When we perform an …